팔레스타인의 인구
"오늘의AI위키"의 AI를 통해 더욱 풍부하고 폭넓은 지식 경험을 누리세요.
1. 개요
팔레스타인의 인구는 역사적으로 변화를 겪었으며, 현재 팔레스타인 영토(서안 지구, 가자 지구, 동예루살렘)와 이스라엘 내 팔레스타인인, 그리고 팔레스타인 난민으로 구성된다. 2019년 유엔 통계에 따르면 팔레스타인 전체 인구는 약 500만 명이며, 2023년 가자 지구에는 약 210만 명이 거주했다. 팔레스타인 인구는 높은 출생률과 기대 수명 증가, 그리고 팔레스타인 난민 문제와 관련된 복잡한 쟁점을 포함한다.
더 읽어볼만한 페이지
- 팔레스타인의 사회 - 나크바
나크바는 1948년 팔레스타인 전쟁으로 인해 팔레스타인인들이 대규모 이주와 재산 상실, 사회 구조 붕괴를 겪은 '대재앙'을 의미하며, 팔레스타인인들에게 민족적 트라우마로 남아 현재까지 장기적인 영향을 미치고 있지만, 이스라엘에서는 독립 전쟁으로 기념하며 나크바 주장을 부정한다.
| 팔레스타인의 인구 | |
|---|---|
| 개요 | |
 | |
| 위치 | 팔레스타인 |
| 사용 언어 | 아랍어 히브리어 (이스라엘 정착민 및 많은 팔레스타인 사람들이 사용) |
| 인구 통계 | |
| 총 인구 | 가자 지구: 1,997,328명 (2022년 추정) 요르단 강 서안 지구: 3,000,021명 (2022년 추정) |
| 인구 성장률 | 가자 지구: 2.02% (2022년 추정) 요르단 강 서안 지구: 1.69% (2022년 추정) |
| 출생률 | 가자 지구: 1,000명당 27.67명 (2022년 추정) 요르단 강 서안 지구: 1,000명당 24.42명 (2022년 추정) |
| 사망률 | 가자 지구: 1,000명당 2.91명 (2022년 추정) 요르단 강 서안 지구: 1,000명당 3.4명 (2022년 추정) |
2. 팔레스타인 지역의 역사적 인구 변화
2. 1. 고대 ~ 오스만 제국 시기
2. 2. 영국 위임통치 시기 (1922년 ~ 1948년)
2. 3. 1948년 아랍-이스라엘 전쟁과 그 이후
2. 4. 1967년 6일 전쟁과 그 이후
3. 팔레스타인 영토 (서안 지구, 가자 지구, 동예루살렘)의 인구 통계
| 연앙 인구 (백만 명)[54][55][56] | |||
|---|---|---|---|
| 연도 | 서안 지구 | 가자 지구 | 전체 |
| 1970 | 0.69 | 0.34 | 1.03 |
| 1980 | 0.90 | 0.46 | 1.36 |
| 1990 | 1.25 | 0.65 | 1.90 |
| 2000 | 1.98 | 1.13 | 3.11 |
| 2010 | 2.52 | 1.60 | 4.12 |
| 2014 | 2.73 | 1.82 | 4.55 |
| 출처: 미국 인구조사국 | |||
| 2006 | 2.5 | 1.5 | 4.0 |
| 2009 | 2.48 | 1.45 | 3.94 |
| 출처: 팔레스타인 통계청 | |||
유엔은 서안 지구도 팔레스타인의 영토로 인정하고 있기 때문에, 유엔의 통계는 서안 지구의 인구도 포함되어 있음을 유의해야 한다.
'''2019년 유엔 인구 통계'''[65][66]
- 총인구: 500만 명
- 15세 미만 인구: 38.7%
- 15~24세 인구: 20.3%
- 25~64세 인구: 37.9%
- 65세 이상 인구: 3.2%
- 노인 부양 가능 인구(65세 이상 노인 1명당 25~64세 노동 인구): 11.9명
- 인구 성장률: 2.4%
- 조출생률(인구 1000명당): 28.7명
- 합계출산율: 3.56명
- 조사망률(인구 1000명당): 3.5명
- 영아사망률(1살 미만 1000명당): 17명
- 유아사망률(5세 미만 1000명당): 20명
- 출생시 기대수명: 74.1세
3. 1. 서안 지구
| 연앙 인구 (백만 명)[54][55][56] | |||
|---|---|---|---|
| 연도 | 서안 지구 | 가자 지구 | 전체 |
| 1970 | 0.69 | 0.34 | 1.03 |
| 1980 | 0.90 | 0.46 | 1.36 |
| 1990 | 1.25 | 0.65 | 1.90 |
| 2000 | 1.98 | 1.13 | 3.11 |
| 2010 | 2.52 | 1.60 | 4.12 |
| 2014 | 2.73 | 1.82 | 4.55 |
| 출처: 미국 인구조사국 | |||
| 2006 | 2.5 | 1.5 | 4.0 |
| 2009 | 2.48 | 1.45 | 3.94 |
| 출처: 팔레스타인 통계청 | |||
유엔은 서안 지구도 팔레스타인의 영토로 인정하고 있기 때문에, 유엔의 통계는 서안 지구의 인구도 포함되어 있음을 유의해야 한다.
'''2019년 유엔 인구 통계'''[65][66]
- 총인구: 500만 명
- 15세 미만 인구: 38.7%
- 15~24세 인구: 20.3%
- 25~64세 인구: 37.9%
- 65세 이상 인구: 3.2%
- 노인 부양 가능 인구(65세 이상 노인 1명당 25~64세 노동 인구): 11.9명
- 인구 성장률: 2.4%
- 조출생률(인구 1000명당): 28.7명
- 합계출산율: 3.56명
- 조사망률(인구 1000명당): 3.5명
- 영아사망률(1살 미만 1000명당): 17명
- 유아사망률(5세 미만 1000명당): 20명
- 출생시 기대수명: 74.1세
2007년 12월 1일 팔레스타인 자치 정부의 인구 조사(1967년 이스라엘에 점령된 동예루살렘 지역은 제외)에 따르면, 서안 지구의 성별 및 연령별 인구 구조는 다음과 같다.[69]
| 연령대 | 남성 | 여성 | 전체 | % |
|---|---|---|---|---|
| 전체 | 1,747,284 | 1,696,544 | 3,443,828 | 100 |
| 0-4 | 266,052 | 253,883 | 519,935 | 15.10 |
| 5-9 | 239,156 | 227,724 | 466,880 | 13.56 |
| 10-14 | 238,306 | 227,967 | 466,273 | 13.54 |
| 15-19 | 211,464 | 202,975 | 414,439 | 12.03 |
| 20-24 | 158,374 | 151,561 | 309,935 | 9.00 |
| 25-29 | 128,068 | 124,159 | 252,227 | 7.32 |
| 30-34 | 108,945 | 106,343 | 215,288 | 6.25 |
| 35-39 | 90,155 | 86,905 | 177,060 | 5.14 |
| 40-44 | 81,186 | 75,328 | 156,514 | 4.54 |
| 45-49 | 60,832 | 56,748 | 117,580 | 3.41 |
| 50-54 | 41,606 | 41,695 | 83,301 | 2.42 |
| 55-59 | 32,011 | 30,999 | 63,010 | 1.83 |
| 60-64 | 22,060 | 25,769 | 47,829 | 1.39 |
| 65-69 | 13,853 | 19,844 | 33,697 | 0.98 |
| 70-74 | 12,689 | 16,627 | 29,316 | 0.85 |
| 75-79 | 8,599 | 12,536 | 21,135 | 0.61 |
| 80-84 | 4,861 | 6,888 | 11,749 | 0.34 |
| 85-89 | 2,318 | 3,026 | 5,344 | 0.16 |
| 90-94 | 871 | 1,133 | 2,004 | 0.06 |
| 95+ | 464 | 597 | 1,061 | 0.03 |
| 불명 | 25,414 | 23,837 | 49,251 | 0.14 |
| 연령대 | 남성 | 여성 | 전체 | % |
|---|---|---|---|---|
| 0-14 | 743,514 | 709,574 | 1,453,088 | 42.19 |
| 15-64 | 934,701 | 902,482 | 1,837,183 | 53.35 |
| 65+ | 43,655 | 60,651 | 104,306 | 3.03 |
2013년 7월 1일 추산에 따르면, 팔레스타인의 성별 및 연령별 인구 구조는 다음과 같다.
| 연령대 | 남성 | 여성 | 전체 | % |
|---|---|---|---|---|
| 전체 | 2,245,400 | 2,175,149 | 4,420,549 | 100 |
| 0-4 | 333,246 | 319,213 | 652,459 | 14.76 |
| 5-9 | 295,678 | 283,886 | 579,564 | 13.11 |
| 10-14 | 275,428 | 263,679 | 539,107 | 12.20 |
| 15-19 | 262,267 | 251,710 | 513,977 | 11.63 |
| 20-24 | 230,888 | 221,790 | 452,678 | 10.24 |
| 25-29 | 182,448 | 174,730 | 357,178 | 8.08 |
| 30-34 | 144,721 | 138,652 | 283,373 | 6.41 |
| 35-39 | 122,846 | 119,333 | 242,179 | 5.48 |
| 40-44 | 103,233 | 100,276 | 203,509 | 4.60 |
| 45-49 | 87,969 | 82,580 | 170,549 | 3.86 |
| 50-54 | 70,535 | 65,239 | 135,774 | 3.07 |
| 55-59 | 48,912 | 46,910 | 95,822 | 2.17 |
| 60-64 | 32,353 | 33,581 | 65,934 | 1.49 |
| 65-69 | 21,985 | 26,414 | 48,399 | 1.09 |
| 70-74 | 14,201 | 19,831 | 34,032 | 0.77 |
| 75-79 | 9,344 | 13,728 | 23,072 | 0.52 |
| 80+ | 9,346 | 13,597 | 22,943 | 0.52 |
| 연령대 | 남성 | 여성 | 전체 | % |
|---|---|---|---|---|
| 0-14 | 904,352 | 866,778 | 1,771,130 | 40.07 |
| 15-64 | 1,286,172 | 1,234,801 | 2,520,973 | 57.03 |
| 65+ | 54,876 | 73,570 | 128,446 | 2.91 |
2018년 추정치에 따르면, 팔레스타인의 연령대별 인구 비율은 다음과 같다.[42]
- 0–14세: 36.1% (남성 518,376명/여성 491,676명)
- 15–24세: 21.8% (남성 302,474명/여성 289,852명)
- 25–54세: 34.5% (남성 489,559명/여성 475,402명)
- 55–64세: 4.7% (남성 68,317명/여성 64,233명)
- 65세 이상: 3.5% (남성 44,662명/여성 53,943명)
2017년 추정치에 따르면, 팔레스타인의 성비는 다음과 같다.
- 출생 시: 1.06 명(남성)/여성
- 0–14세: 1.05 명(남성)/여성
- 15–24세: 1.04 명(남성)/여성
- 25–54세: 1.03 명(남성)/여성
- 55–64세: 1.06 명(남성)/여성
- 65세 이상: 0.73 명(남성)/여성
- 전체 인구: 1.04 명(남성)/여성
| 연도 | 출생아 수 | 사망자 수 | 자연 증감 | 조출생률 | 조사망률 | 자연 증감률 | 합계출산율 |
|---|---|---|---|---|---|---|---|
| 2010 | 137,085 | 10,764 | 126,231 | align="right" | | align="right" | | align="right" | | 4.4 |
| 2011 | 131,430 | 11,333 | 120,097 | align="right" | | align="right" | | align="right" | | align="right" | |
| 2012 | 129,826 | 11,676 | 118,150 | align="right" | | align="right" | | align="right" | | align="right" | |
| 2013 | 126,912 | 11,013 | 115,899 | align="right" | | align="right" | | align="right" | | 4.1 |
| 합계출산율 | 조출생률 | 조사망률 | 자연 증감 | |
|---|---|---|---|---|
| 1997 | style="text-align:right;" | | 41.2 | 5.1 | 36.1 |
| 2000 | style="text-align:right;" | | 38.8 | 4.6 | 34.2 |
| 2005 | style="text-align:right;" | | 34.5 | 4.1 | 30.4 |
| 2009 | style="text-align:right;" | | 30.1 | 4.4 | 25.7 |
| 2010 | 3.8 | 30.1 | 4.2 | 25.9 |
| 2011 | style="text-align:right;" | | 30.1 | 4.1 | 26.0 |
| 2013 | style="text-align:right;" | | 29.7 | 4.0 | 25.7 |
[64]
2018년, CIA 월드 팩트북(The World Factbook)에 따르면, 서안 지구는 합계출산율 3.2명으로 48위였다.[32] 같은 해, 서안 지구의 추정 인구 성장률은 1.81%였다.[48][47][33]
2018년 서안 지구의 출생률은 인구 1,000명당 26명, 사망률은 인구 1,000명당 3.5명이었다.[43]
2018년 서안 지구의 영아 사망률은 총 1,000명 출생 당 13.6명이었으며, 남아는 1,000명 출생 당 15.3명, 여아는 1,000명 출생당 11.9명 사망했다.[43] 같은 해 서안 지구의 합계 출산율은 3.2명이었다.[43]
서안 지구의 유대인 인구의 합계 출산율은 여성 1인당 5.07명이다.[53]
| 기간 | 기대수명 | 기간 | 기대수명 |
|---|---|---|---|
| 1950–1955 | 46.6 | 1985–1990 | 66.95 |
| 1955–1960 | 48.23 | 1990–1995 | 68.95 |
| 1960–1965 | 50.76 | 1995–2000 | 70.42 |
| 1965–1970 | 54.09 | 2000–2005 | 71.53 |
| 1970–1975 | 57.44 | 2005–2010 | 72.45 |
| 1975–1980 | 60.66 | 2010–2015 | 73.09 |
| 1980–1985 | 64.21 | 2015-2020 | 73.82 |
출처: 유엔 세계인구전망 2019[67]
0세의 총 인구의 평균 기대 수명.[44]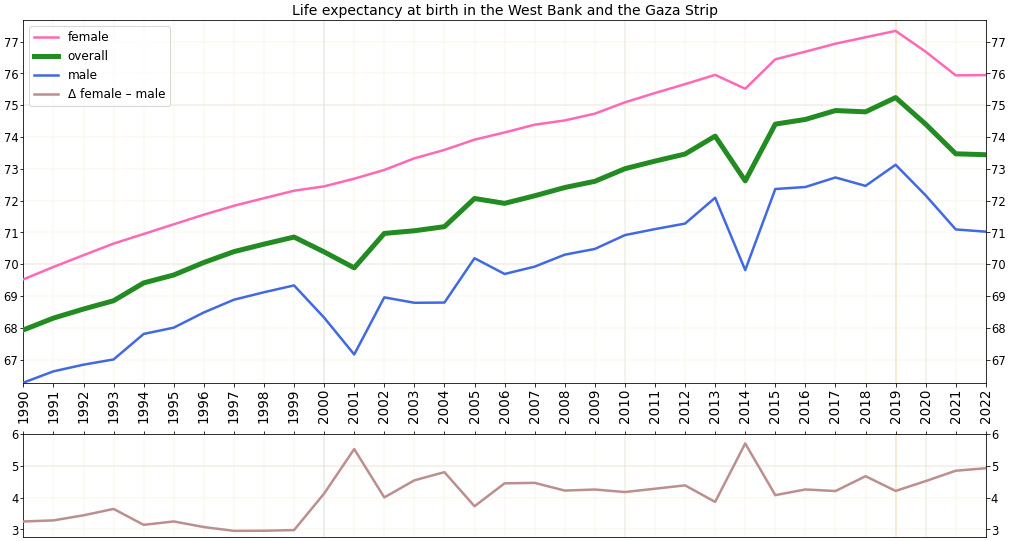
| 기간 | 기대 수명 (년) | 기간 | 기대 수명 (년) |
|---|---|---|---|
| 1950–1955 | 46.6 | 1985–1990 | 67.1 |
| 1955–1960 | 48.2 | 1990–1995 | 68.9 |
| 1960–1965 | 50.8 | 1995–2000 | 70.3 |
| 1965–1970 | 54.1 | 2000–2005 | 71.2 |
| 1970–1975 | 57.5 | 2005–2010 | 72.0 |
| 1975–1980 | 61.0 | 2010–2015 | 72.9 |
| 1980–1985 | 64.4 |
전체 인구: 75.4세
남성: 73.4세
여성: 77.6세 (2018년 추정)
3. 1. 1. 인구 통계
| 연앙 인구 (백만 명)[54][55][56] | |||
|---|---|---|---|
| 연도 | 요르단강 서안 지구 | 가자 지구 | 전체 |
| 1970 | 0.69 | 0.34 | 1.03 |
| 1980 | 0.90 | 0.46 | 1.36 |
| 1990 | 1.25 | 0.65 | 1.90 |
| 2000 | 1.98 | 1.13 | 3.11 |
| 2010 | 2.52 | 1.60 | 4.12 |
| 2014 | 2.73 | 1.82 | 4.55 |
| 출처: 미국 인구조사국 | |||
| 2006 | 2.5 | 1.5 | 4.0 |
| 2009 | 2.48 | 1.45 | 3.94 |
| 출처: 팔레스타인 통계청 | |||
| 지역명 | 인구 | 면적 | 인구 밀도 |
|---|---|---|---|
| 요르단강 서안 지구[57] | 2,747,943 | 5,860 | 469[58] |
| 가자 지구[59] | 1,795,183 | 360 | 4,987[60] |
| 전체 | 4,543,126 | 6,220 | 730[61] |
유엔은 서안 지구도 팔레스타인의 영토로 인정하고 있기 때문에, 유엔의 통계는 서안 지구의 인구도 포함되어 있음을 유의해야 한다.
'''2019년 유엔 인구 통계'''[65][66]
- 총인구: 500만 명
- 15세 미만 인구: 38.7%
- 15~24세 인구: 20.3%
- 25~64세 인구: 37.9%
- 65세 이상 인구: 3.2%
- 노인 부양 가능 인구(65세 이상 노인 1명당 25~64세 노동 인구): 11.9명
- 인구 성장률: 2.4%
- 조출생률(인구 1000명당): 28.7명
- 합계출산율: 3.56명
- 조사망률(인구 1000명당): 3.5명
- 영아사망률(1살 미만 1000명당): 17명
- 유아사망률(5세 미만 1000명당): 20명
- 출생시 기대수명: 74.1세
3. 1. 2. 성별 및 연령별 인구 구조
2007년 12월 1일 팔레스타인 자치 정부의 인구 조사(1967년 이스라엘에 점령된 동예루살렘 지역은 제외)에 따르면, 서안 지구의 성별 및 연령별 인구 구조는 다음과 같다.[69]| 연령대 | 남성 | 여성 | 전체 | % |
|---|---|---|---|---|
| 전체 | 1,747,284 | 1,696,544 | 3,443,828 | 100 |
| 0-4 | 266,052 | 253,883 | 519,935 | 15.10 |
| 5-9 | 239,156 | 227,724 | 466,880 | 13.56 |
| 10-14 | 238,306 | 227,967 | 466,273 | 13.54 |
| 15-19 | 211,464 | 202,975 | 414,439 | 12.03 |
| 20-24 | 158,374 | 151,561 | 309,935 | 9.00 |
| 25-29 | 128,068 | 124,159 | 252,227 | 7.32 |
| 30-34 | 108,945 | 106,343 | 215,288 | 6.25 |
| 35-39 | 90,155 | 86,905 | 177,060 | 5.14 |
| 40-44 | 81,186 | 75,328 | 156,514 | 4.54 |
| 45-49 | 60,832 | 56,748 | 117,580 | 3.41 |
| 50-54 | 41,606 | 41,695 | 83,301 | 2.42 |
| 55-59 | 32,011 | 30,999 | 63,010 | 1.83 |
| 60-64 | 22,060 | 25,769 | 47,829 | 1.39 |
| 65-69 | 13,853 | 19,844 | 33,697 | 0.98 |
| 70-74 | 12,689 | 16,627 | 29,316 | 0.85 |
| 75-79 | 8,599 | 12,536 | 21,135 | 0.61 |
| 80-84 | 4,861 | 6,888 | 11,749 | 0.34 |
| 85-89 | 2,318 | 3,026 | 5,344 | 0.16 |
| 90-94 | 871 | 1,133 | 2,004 | 0.06 |
| 95+ | 464 | 597 | 1,061 | 0.03 |
| 불명 | 25,414 | 23,837 | 49,251 | 0.14 |
| 연령대 | 남성 | 여성 | 전체 | % |
|---|---|---|---|---|
| 0-14 | 743,514 | 709,574 | 1,453,088 | 42.19 |
| 15-64 | 934,701 | 902,482 | 1,837,183 | 53.35 |
| 65+ | 43,655 | 60,651 | 104,306 | 3.03 |
2013년 7월 1일 추산에 따르면, 팔레스타인의 성별 및 연령별 인구 구조는 다음과 같다.
| 연령대 | 남성 | 여성 | 전체 | % |
|---|---|---|---|---|
| 전체 | 2,245,400 | 2,175,149 | 4,420,549 | 100 |
| 0-4 | 333,246 | 319,213 | 652,459 | 14.76 |
| 5-9 | 295,678 | 283,886 | 579,564 | 13.11 |
| 10-14 | 275,428 | 263,679 | 539,107 | 12.20 |
| 15-19 | 262,267 | 251,710 | 513,977 | 11.63 |
| 20-24 | 230,888 | 221,790 | 452,678 | 10.24 |
| 25-29 | 182,448 | 174,730 | 357,178 | 8.08 |
| 30-34 | 144,721 | 138,652 | 283,373 | 6.41 |
| 35-39 | 122,846 | 119,333 | 242,179 | 5.48 |
| 40-44 | 103,233 | 100,276 | 203,509 | 4.60 |
| 45-49 | 87,969 | 82,580 | 170,549 | 3.86 |
| 50-54 | 70,535 | 65,239 | 135,774 | 3.07 |
| 55-59 | 48,912 | 46,910 | 95,822 | 2.17 |
| 60-64 | 32,353 | 33,581 | 65,934 | 1.49 |
| 65-69 | 21,985 | 26,414 | 48,399 | 1.09 |
| 70-74 | 14,201 | 19,831 | 34,032 | 0.77 |
| 75-79 | 9,344 | 13,728 | 23,072 | 0.52 |
| 80+ | 9,346 | 13,597 | 22,943 | 0.52 |
| 연령대 | 남성 | 여성 | 전체 | % |
|---|---|---|---|---|
| 0-14 | 904,352 | 866,778 | 1,771,130 | 40.07 |
| 15-64 | 1,286,172 | 1,234,801 | 2,520,973 | 57.03 |
| 65+ | 54,876 | 73,570 | 128,446 | 2.91 |
2018년 추정치에 따르면, 팔레스타인의 연령대별 인구 비율은 다음과 같다.[42]
- 0–14세: 36.1% (남성 518,376명/여성 491,676명)
- 15–24세: 21.8% (남성 302,474명/여성 289,852명)
- 25–54세: 34.5% (남성 489,559명/여성 475,402명)
- 55–64세: 4.7% (남성 68,317명/여성 64,233명)
- 65세 이상: 3.5% (남성 44,662명/여성 53,943명)
2017년 추정치에 따르면, 팔레스타인의 성비는 다음과 같다.
- 출생 시: 1.06 명(남성)/여성
- 0–14세: 1.05 명(남성)/여성
- 15–24세: 1.04 명(남성)/여성
- 25–54세: 1.03 명(남성)/여성
- 55–64세: 1.06 명(남성)/여성
- 65세 이상: 0.73 명(남성)/여성
- 전체 인구: 1.04 명(남성)/여성
3. 1. 3. 출생 및 사망 통계
| 연도 | 출생아 수 | 사망자 수 | 자연 증감 | 조출생률 | 조사망률 | 자연 증감률 | 합계출산율 |
|---|---|---|---|---|---|---|---|
| 2010 | 137,085 | 10,764 | 126,231 | align="right" | | align="right" | | align="right" | | 4.4 |
| 2011 | 131,430 | 11,333 | 120,097 | align="right" | | align="right" | | align="right" | | align="right" | |
| 2012 | 129,826 | 11,676 | 118,150 | align="right" | | align="right" | | align="right" | | align="right" | |
| 2013 | 126,912 | 11,013 | 115,899 | align="right" | | align="right" | | align="right" | | 4.1 |
| 합계출산율 | 조출생률 | 조사망률 | 자연 증감 | |
|---|---|---|---|---|
| 1997 | style="text-align:right;" | | 41.2 | 5.1 | 36.1 |
| 2000 | style="text-align:right;" | | 38.8 | 4.6 | 34.2 |
| 2005 | style="text-align:right;" | | 34.5 | 4.1 | 30.4 |
| 2009 | style="text-align:right;" | | 30.1 | 4.4 | 25.7 |
| 2010 | 3.8 | 30.1 | 4.2 | 25.9 |
| 2011 | style="text-align:right;" | | 30.1 | 4.1 | 26.0 |
| 2013 | style="text-align:right;" | | 29.7 | 4.0 | 25.7 |
[64]
2018년, CIA 월드 팩트북(The World Factbook)에 따르면, 서안 지구는 합계출산율 3.2명으로 48위였다.[32] 같은 해, 서안 지구의 추정 인구 성장률은 1.81%였다.[48][47][33]
2018년 서안 지구의 출생률은 인구 1,000명당 26명, 사망률은 인구 1,000명당 3.5명이었다.[43]
2018년 서안 지구의 영아 사망률은 총 1,000명 출생 당 13.6명이었으며, 남아는 1,000명 출생 당 15.3명, 여아는 1,000명 출생당 11.9명 사망했다.[43] 같은 해 서안 지구의 합계 출산율은 3.2명이었다.[43]
서안 지구의 유대인 인구의 합계 출산율은 여성 1인당 5.07명이다.[53]
3. 1. 4. 기대 수명
wikitable| 기간 | 기대수명 | 기간 | 기대수명 |
|---|---|---|---|
| 1950–1955 | 46.6 | 1985–1990 | 66.95 |
| 1955–1960 | 48.23 | 1990–1995 | 68.95 |
| 1960–1965 | 50.76 | 1995–2000 | 70.42 |
| 1965–1970 | 54.09 | 2000–2005 | 71.53 |
| 1970–1975 | 57.44 | 2005–2010 | 72.45 |
| 1975–1980 | 60.66 | 2010–2015 | 73.09 |
| 1980–1985 | 64.21 | 2015-2020 | 73.82 |
출처: 유엔 세계인구전망 2019[67]
0세의 총 인구의 평균 기대 수명.[44]
| 기간 | 기대 수명 (년) | 기간 | 기대 수명 (년) |
|---|---|---|---|
| 1950–1955 | 46.6 | 1985–1990 | 67.1 |
| 1955–1960 | 48.2 | 1990–1995 | 68.9 |
| 1960–1965 | 50.8 | 1995–2000 | 70.3 |
| 1965–1970 | 54.1 | 2000–2005 | 71.2 |
| 1970–1975 | 57.5 | 2005–2010 | 72.0 |
| 1975–1980 | 61.0 | 2010–2015 | 72.9 |
| 1980–1985 | 64.4 |
전체 인구: 75.4세
남성: 73.4세
여성: 77.6세 (2018년 추정)
3. 2. 가자 지구
wikitext| 연앙 인구 (백만 명)[54][55][56] | |||
|---|---|---|---|
| 연도 | 서안 지구 | 가자 지구 | 전체 |
| 1970 | 0.69 | 0.34 | 1.03 |
| 1980 | 0.90 | 0.46 | 1.36 |
| 1990 | 1.25 | 0.65 | 1.90 |
| 2000 | 1.98 | 1.13 | 3.11 |
| 2010 | 2.52 | 1.60 | 4.12 |
| 2014 | 2.73 | 1.82 | 4.55 |
| 출처: 미국 인구조사국 | |||
| 2006 | 2.5 | 1.5 | 4.0 |
| 2009 | 2.48 | 1.45 | 3.94 |
| 출처: 팔레스타인 통계청 | |||
- 총인구: 500만 명
- 15세 미만 인구: 38.7%
- 15~24세 인구: 20.3%
- 25~64세 인구: 37.9%
- 65세 이상 인구: 3.2%
- 노인 부양 가능 인구(65세 이상 노인 1명당 25~64세 노동 인구): 11.9명
- 인구 성장률: 2.4%
- 조출생률(인구 1000명당): 28.7명
- 합계출산율: 3.56명
- 조사망률(인구 1000명당): 3.5명
- 영아사망률(1살 미만 1000명당): 17명
- 유아사망률(5세 미만 1000명당): 20명
- 출생시 기대수명: 74.1세
2023년 가자 지구에는 약 210만 명의 팔레스타인인이 거주했으며,[47] 이 중 약 160만 명이 유엔 등록 난민이었다.[45] 가자 지구의 인구는 계속 증가하고 있으며, 여성 1인당 3.38명의 자녀를 낳는 합계출산율 (2023년 추산)이 주요 원인 중 하나이다. 합계출산율 순위에서 가자 지구는 224개 지역 중 42위를 차지했다.[47]
=== 성별 및 연령별 인구 구조 ===
2007년 12월 1일 팔레스타인 자치 정부의 인구 조사에 따르면, 팔레스타인의 성별 및 연령별 인구 구조는 다음과 같다.[69] 이 조사에는 1967년 이스라엘에 점령된 예루살렘 지역은 포함되지 않았다.
| 연령대 | 남성 | 여성 | 전체 | % |
|---|---|---|---|---|
| 전체 | 1,747,284 | 1,696,544 | 3,443,828 | 100 |
| 0-4 | 266,052 | 253,883 | 519,935 | 15.10 |
| 5-9 | 239,156 | 227,724 | 466,880 | 13.56 |
| 10-14 | 238,306 | 227,967 | 466,273 | 13.54 |
| 15-19 | 211,464 | 202,975 | 414,439 | 12.03 |
| 20-24 | 158,374 | 151,561 | 309,935 | 9.00 |
| 25-29 | 128,068 | 124,159 | 252,227 | 7.32 |
| 30-34 | 108,945 | 106,343 | 215,288 | 6.25 |
| 35-39 | 90,155 | 86,905 | 177,060 | 5.14 |
| 40-44 | 81,186 | 75,328 | 156,514 | 4.54 |
| 45-49 | 60,832 | 56,748 | 117,580 | 3.41 |
| 50-54 | 41,606 | 41,695 | 83,301 | 2.42 |
| 55-59 | 32,011 | 30,999 | 63,010 | 1.83 |
| 60-64 | 22,060 | 25,769 | 47,829 | 1.39 |
| 65-69 | 13,853 | 19,844 | 33,697 | 0.98 |
| 70-74 | 12,689 | 16,627 | 29,316 | 0.85 |
| 75-79 | 8,599 | 12,536 | 21,135 | 0.61 |
| 80-84 | 4,861 | 6,888 | 11,749 | 0.34 |
| 85-89 | 2,318 | 3,026 | 5,344 | 0.16 |
| 90-94 | 871 | 1,133 | 2,004 | 0.06 |
| 95+ | 464 | 597 | 1,061 | 0.03 |
| 불명 | 25,414 | 23,837 | 49,251 | 0.14 |
| 연령대 | 남성 | 여성 | 전체 | % |
|---|---|---|---|---|
| 0-14 | 743,514 | 709,574 | 1,453,088 | 42.19 |
| 15-64 | 934,701 | 902,482 | 1,837,183 | 53.35 |
| 65+ | 43,655 | 60,651 | 104,306 | 3.03 |
2013년 7월 1일 추산된 팔레스타인의 성별 및 연령별 인구 구조는 다음과 같다.
| 연령대 | 남성 | 여성 | 전체 | % |
|---|---|---|---|---|
| 전체 | 2,245,400 | 2,175,149 | 4,420,549 | 100 |
| 0-4 | 333,246 | 319,213 | 652,459 | 14.76 |
| 5-9 | 295,678 | 283,886 | 579,564 | 13.11 |
| 10-14 | 275,428 | 263,679 | 539,107 | 12.20 |
| 15-19 | 262,267 | 251,710 | 513,977 | 11.63 |
| 20-24 | 230,888 | 221,790 | 452,678 | 10.24 |
| 25-29 | 182,448 | 174,730 | 357,178 | 8.08 |
| 30-34 | 144,721 | 138,652 | 283,373 | 6.41 |
| 35-39 | 122,846 | 119,333 | 242,179 | 5.48 |
| 40-44 | 103,233 | 100,276 | 203,509 | 4.60 |
| 45-49 | 87,969 | 82,580 | 170,549 | 3.86 |
| 50-54 | 70,535 | 65,239 | 135,774 | 3.07 |
| 55-59 | 48,912 | 46,910 | 95,822 | 2.17 |
| 60-64 | 32,353 | 33,581 | 65,934 | 1.49 |
| 65-69 | 21,985 | 26,414 | 48,399 | 1.09 |
| 70-74 | 14,201 | 19,831 | 34,032 | 0.77 |
| 75-79 | 9,344 | 13,728 | 23,072 | 0.52 |
| 80+ | 9,346 | 13,597 | 22,943 | 0.52 |
| 연령대 | 남성 | 여성 | 전체 | % |
|---|---|---|---|---|
| 0-14 | 904,352 | 866,778 | 1,771,130 | 40.07 |
| 15-64 | 1,286,172 | 1,234,801 | 2,520,973 | 57.03 |
| 65+ | 54,876 | 73,570 | 128,446 | 2.91 |
[42]
2018년 추정치에 따르면, 팔레스타인의 연령대별 인구 비율은 다음과 같다:
- 0–14세: 44.1% (남성 415,746명/여성 394,195명)
- 15–24세: 21.3% (남성 197,797명/여성 194,112명)
- 25–54세: 28.5% (남성 256,103명/여성 267,285명)
- 55–64세: 3.5% (남성 33,413명/여성 30,592명)
- 65세 이상: 2.6% (남성 24,863명/여성 22,607명)
2017년 추정치에 따르면, 팔레스타인의 성비는 다음과 같다:
- 출생 시: 1.06 명/여아
- 0–14세: 1.05 명/여아
- 15–24세: 1.01 명/여아
- 25–54세: 0.96 명/여아
- 55–64세: 1.1 명/여아
- 65세 이상: 0.71 명/여아
- 전체 인구: 1.02 명/여아
=== 출생 및 사망 통계 ===
| 연도 | 인구 | 출생아 수 | 사망자 수 | 자연 증감 | 조출생률 | 조사망률 | 자연 증감률 | 합계출산율 |
|---|---|---|---|---|---|---|---|---|
| 2010 | align="right" | | 137,085 | 10,764 | 126,231 | align="right" | | align="right" | | align="right" | | 4.4 |
| 2011 | align="right" | | 131,430 | 11,333 | 120,097 | align="right" | | align="right" | | align="right" | | align="right" | |
| 2012 | align="right" | | 129,826 | 11,676 | 118,150 | align="right" | | align="right" | | align="right" | | align="right" | |
| 2013 | align="right" | | 126,912 | 11,013 | 115,899 | align="right" | | align="right" | | align="right" | | 4.1 |
| 출산율 | 출생률 | 사망률 | 자연 증감 | |
|---|---|---|---|---|
| 1997 | style="text-align:right;" | | 45.4 | 4.7 | 40.7 |
| 2000 | style="text-align:right;" | | 44.5 | 4.3 | 40.2 |
| 2005 | style="text-align:right;" | | 42.2 | 3.9 | 39.3 |
| 2009 | style="text-align:right;" | | 36.9 | 4.1 | 32.8 |
| 2010 | 4.9 | 37.1 | 4.0 | 33.1 |
| 2011 | style="text-align:right;" | | 37.2 | 3.9 | 34.3 |
| 2013 | style="text-align:right;" | | 37.1 | 3.7 | 34.4 |
| 출산율 | 출생률 | 사망률 | 자연 증감 | |
|---|---|---|---|---|
| 1997 | style="text-align:right;" | | 41.2 | 5.1 | 36.1 |
| 2000 | style="text-align:right;" | | 38.8 | 4.6 | 34.2 |
| 2005 | style="text-align:right;" | | 34.5 | 4.1 | 30.4 |
| 2009 | style="text-align:right;" | | 30.1 | 4.4 | 25.7 |
| 2010 | 3.8 | 30.1 | 4.2 | 25.9 |
| 2011 | style="text-align:right;" | | 30.1 | 4.1 | 26.0 |
| 2013 | style="text-align:right;" | | 29.7 | 4.0 | 25.7 |
[64]
{| class="wikitable"
!기간
!출생아 수
(천 명)
!사망자 수
(천 명)
!자연 증감
(천 명)
!조출생률
!조사망률
!합계출산율
!영아 사망률
!유아 사망률
!출생 성비
!인구 성장률
|-
|1950–1955
| style="text-align:right;" |220
| style="text-align:right;" |96
| style="text-align:right;" |125
| style="text-align:right;" |45.9
| style="text-align:right;" |20.0
| style="text-align:right;" |7.38
| style="text-align:right;" |141
| style="text-align:right;" |210
| style="text-align:right;" |105
| style="text-align:right;" |1.2
|-
|1965–1970
| style="text-align:right;" |298
| style="text-align:right;" |81
| style="text-align:right;" |217
| style="text-align:right;" |51.4
| style="text-align:right;" |14.0
| style="text-align:right;" |8.00
| style="text-align:right;" |99
| style="text-align:right;" |143
| style="text-align:right;" |105
| style="text-align:right;" | -1.1
|-
|1985–1990
| style="text-align:right;" |435
| style="text-align:right;" |54
| style="text-align:right;" |381
| style="text-align:right;" |45.1
| style="text-align:right;" |5.6
| style="text-align:right;" |6.76
| style="text-align:right;" |41
| style="text-align:right;" |51
| style="text-align:right;" |105
| style="text-align:right;" |3.6
|-
|1995–2000
| style="text-align:right;" |595
| style="text-align:right;" |60
| style="text-align:right;" |535
| style="text-align:right;" |40.7
| style="text-align:right;" |4.1
| style="text-align:right;" |5.81
| style="text-align:right;" |27
| style="text-align:right;" |33
| style="text-align:right;" |105
| style="text-align:right;" |4.2
|-
|2000–2005
| style="text-align:right;" |607
| style="text-align:right;" |63
| style="text-align:right;" |544
| style="text-align:right;" |35.7
| style="text-align:right;" |3.7
| style="text-align:right;" |5.02
| style="text-align:right;" |24
| style="text-align:right;" |28
| style="text-align:right;" |105
| style="text-align:right;" |2.1
|-
|2005–2010
| style="text-align:right;" |649
| style="text-align:right;" |67
| style="text-align:right;" |581
| style="text-align:right;" |34.0
| style="text-align:right;" |3.5
| style="text-align:right;" |4.60
| style="text-align:right;" |21
| style="text-align:right;" |25
| style="text-align:right;" |105
| style="text-align:right;" |2.5
|-
|2010-2015
| style="text-align:right;" |706
| style="text-align:right;" |75
| style="text-align:right;" |631
| style="text-align:right;" |32.9
| style="text-align:right;" |3.5
| style="text-align:right;" |4.25
| style="text-align:right;" |19
| style="text-align:right;" |23
| style="text-align:right;" |105
| style="text-align:right;" |2.2
|-
|2015-2020
| style="text-align:right;" |708
| style="text-align:right;" |83
| style="text-align:right;" |625
| style="text-align:right;" |29.4
| style="text-align:right;" |3.5
| style="text-align:right;" |3.67
| style="text-align:right;" |17
| style="text-align:right;" |20
| style="text-align:right;" |105
| style="text-align:right;" |2.4
|-
| colspan="11" |* 연평균 기준이며, 예외적으로 출생아 수, 사망자 수, 자연 증감의 경우 연평균 기준이 아닌, 해당
3. 2. 1. 인구 통계
| 연앙 인구 (백만 명)[54][55][56] | |||
|---|---|---|---|
| 연도 | 서안 지구 | 가자 지구 | 전체 |
| 1970 | 0.69 | 0.34 | 1.03 |
| 1980 | 0.90 | 0.46 | 1.36 |
| 1990 | 1.25 | 0.65 | 1.90 |
| 2000 | 1.98 | 1.13 | 3.11 |
| 2010 | 2.52 | 1.60 | 4.12 |
| 2014 | 2.73 | 1.82 | 4.55 |
| 출처: 미국 인구조사국 | |||
| 2006 | 2.5 | 1.5 | 4.0 |
| 2009 | 2.48 | 1.45 | 3.94 |
| 출처: 팔레스타인 통계청 | |||
- 총인구: 500만 명
- 15세 미만 인구: 38.7%
- 15~24세 인구: 20.3%
- 25~64세 인구: 37.9%
- 65세 이상 인구: 3.2%
- 노인 부양 가능 인구(65세 이상 노인 1명당 25~64세 노동 인구): 11.9명
- 인구 성장률: 2.4%
- 조출생률(인구 1000명당): 28.7명
- 합계출산율: 3.56명
- 조사망률(인구 1000명당): 3.5명
- 영아사망률(1살 미만 1000명당): 17명
- 유아사망률(5세 미만 1000명당): 20명
- 출생시 기대수명: 74.1세
2023년 가자 지구에는 약 210만 명의 팔레스타인인이 거주했으며,[47] 이 중 약 160만 명이 유엔 등록 난민이었다.[45] 가자 지구의 인구는 계속 증가하고 있으며, 여성 1인당 3.38명의 자녀를 낳는 합계출산율 (2023년 추산)이 주요 원인 중 하나이다. 합계출산율 순위에서 가자 지구는 224개 지역 중 42위를 차지했다.[47]
3. 2. 2. 성별 및 연령별 인구 구조
2007년 12월 1일 팔레스타인 자치 정부의 인구 조사에 따르면, 팔레스타인의 성별 및 연령별 인구 구조는 다음과 같다.[69] 이 조사에는 1967년 이스라엘에 점령된 예루살렘 지역은 포함되지 않았다.| 연령대 | 남성 | 여성 | 전체 | % |
|---|---|---|---|---|
| 전체 | 1,747,284 | 1,696,544 | 3,443,828 | 100 |
| 0-4 | 266,052 | 253,883 | 519,935 | 15.10 |
| 5-9 | 239,156 | 227,724 | 466,880 | 13.56 |
| 10-14 | 238,306 | 227,967 | 466,273 | 13.54 |
| 15-19 | 211,464 | 202,975 | 414,439 | 12.03 |
| 20-24 | 158,374 | 151,561 | 309,935 | 9.00 |
| 25-29 | 128,068 | 124,159 | 252,227 | 7.32 |
| 30-34 | 108,945 | 106,343 | 215,288 | 6.25 |
| 35-39 | 90,155 | 86,905 | 177,060 | 5.14 |
| 40-44 | 81,186 | 75,328 | 156,514 | 4.54 |
| 45-49 | 60,832 | 56,748 | 117,580 | 3.41 |
| 50-54 | 41,606 | 41,695 | 83,301 | 2.42 |
| 55-59 | 32,011 | 30,999 | 63,010 | 1.83 |
| 60-64 | 22,060 | 25,769 | 47,829 | 1.39 |
| 65-69 | 13,853 | 19,844 | 33,697 | 0.98 |
| 70-74 | 12,689 | 16,627 | 29,316 | 0.85 |
| 75-79 | 8,599 | 12,536 | 21,135 | 0.61 |
| 80-84 | 4,861 | 6,888 | 11,749 | 0.34 |
| 85-89 | 2,318 | 3,026 | 5,344 | 0.16 |
| 90-94 | 871 | 1,133 | 2,004 | 0.06 |
| 95+ | 464 | 597 | 1,061 | 0.03 |
| 불명 | 25,414 | 23,837 | 49,251 | 0.14 |
| 연령대 | 남성 | 여성 | 전체 | % |
|---|---|---|---|---|
| 0-14 | 743,514 | 709,574 | 1,453,088 | 42.19 |
| 15-64 | 934,701 | 902,482 | 1,837,183 | 53.35 |
| 65+ | 43,655 | 60,651 | 104,306 | 3.03 |
2013년 7월 1일 추산된 팔레스타인의 성별 및 연령별 인구 구조는 다음과 같다.
| 연령대 | 남성 | 여성 | 전체 | % |
|---|---|---|---|---|
| 전체 | 2,245,400 | 2,175,149 | 4,420,549 | 100 |
| 0-4 | 333,246 | 319,213 | 652,459 | 14.76 |
| 5-9 | 295,678 | 283,886 | 579,564 | 13.11 |
| 10-14 | 275,428 | 263,679 | 539,107 | 12.20 |
| 15-19 | 262,267 | 251,710 | 513,977 | 11.63 |
| 20-24 | 230,888 | 221,790 | 452,678 | 10.24 |
| 25-29 | 182,448 | 174,730 | 357,178 | 8.08 |
| 30-34 | 144,721 | 138,652 | 283,373 | 6.41 |
| 35-39 | 122,846 | 119,333 | 242,179 | 5.48 |
| 40-44 | 103,233 | 100,276 | 203,509 | 4.60 |
| 45-49 | 87,969 | 82,580 | 170,549 | 3.86 |
| 50-54 | 70,535 | 65,239 | 135,774 | 3.07 |
| 55-59 | 48,912 | 46,910 | 95,822 | 2.17 |
| 60-64 | 32,353 | 33,581 | 65,934 | 1.49 |
| 65-69 | 21,985 | 26,414 | 48,399 | 1.09 |
| 70-74 | 14,201 | 19,831 | 34,032 | 0.77 |
| 75-79 | 9,344 | 13,728 | 23,072 | 0.52 |
| 80+ | 9,346 | 13,597 | 22,943 | 0.52 |
| 연령대 | 남성 | 여성 | 전체 | % |
|---|---|---|---|---|
| 0-14 | 904,352 | 866,778 | 1,771,130 | 40.07 |
| 15-64 | 1,286,172 | 1,234,801 | 2,520,973 | 57.03 |
| 65+ | 54,876 | 73,570 | 128,446 | 2.91 |
[42]
2018년 추정치에 따르면, 팔레스타인의 연령대별 인구 비율은 다음과 같다:
- 0–14세: 44.1% (남성 415,746명/여성 394,195명)
- 15–24세: 21.3% (남성 197,797명/여성 194,112명)
- 25–54세: 28.5% (남성 256,103명/여성 267,285명)
- 55–64세: 3.5% (남성 33,413명/여성 30,592명)
- 65세 이상: 2.6% (남성 24,863명/여성 22,607명)
2017년 추정치에 따르면, 팔레스타인의 성비는 다음과 같다:
- 출생 시: 1.06 명/여아
- 0–14세: 1.05 명/여아
- 15–24세: 1.01 명/여아
- 25–54세: 0.96 명/여아
- 55–64세: 1.1 명/여아
- 65세 이상: 0.71 명/여아
- 전체 인구: 1.02 명/여아
3. 2. 3. 출생 및 사망 통계
| 연도 | 인구 | 출생아 수 | 사망자 수 | 자연 증감 | 조출생률 | 조사망률 | 자연 증감률 | 합계출산율 |
|---|---|---|---|---|---|---|---|---|
| 2010 | align="right" | | 137,085 | 10,764 | 126,231 | align="right" | | align="right" | | align="right" | | 4.4 |
| 2011 | align="right" | | 131,430 | 11,333 | 120,097 | align="right" | | align="right" | | align="right" | | align="right" | |
| 2012 | align="right" | | 129,826 | 11,676 | 118,150 | align="right" | | align="right" | | align="right" | | align="right" | |
| 2013 | align="right" | | 126,912 | 11,013 | 115,899 | align="right" | | align="right" | | align="right" | | 4.1 |
| 출산율 | 출생률 | 사망률 | 자연 증감 | |
|---|---|---|---|---|
| 1997 | style="text-align:right;" | | 45.4 | 4.7 | 40.7 |
| 2000 | style="text-align:right;" | | 44.5 | 4.3 | 40.2 |
| 2005 | style="text-align:right;" | | 42.2 | 3.9 | 39.3 |
| 2009 | style="text-align:right;" | | 36.9 | 4.1 | 32.8 |
| 2010 | 4.9 | 37.1 | 4.0 | 33.1 |
| 2011 | style="text-align:right;" | | 37.2 | 3.9 | 34.3 |
| 2013 | style="text-align:right;" | | 37.1 | 3.7 | 34.4 |
| 출산율 | 출생률 | 사망률 | 자연 증감 | |
|---|---|---|---|---|
| 1997 | style="text-align:right;" | | 41.2 | 5.1 | 36.1 |
| 2000 | style="text-align:right;" | | 38.8 | 4.6 | 34.2 |
| 2005 | style="text-align:right;" | | 34.5 | 4.1 | 30.4 |
| 2009 | style="text-align:right;" | | 30.1 | 4.4 | 25.7 |
| 2010 | 3.8 | 30.1 | 4.2 | 25.9 |
| 2011 | style="text-align:right;" | | 30.1 | 4.1 | 26.0 |
| 2013 | style="text-align:right;" | | 29.7 | 4.0 | 25.7 |
| 기간 | 출생아 수 | 사망자 수 | 자연 증감 | 조출생률 | 조사망률 | 합계출산율 | 영아 사망률 | 유아 사망률 | 출생 성비 | 인구 성장률 |
|---|---|---|---|---|---|---|---|---|---|---|
| 1950–1955 | 220 | 96 | 125 | 45.9 | 20.0 | 7.38 | 141 | 210 | 105 | 1.2 |
| 1965–1970 | 298 | 81 | 217 | 51.4 | 14.0 | 8.00 | 99 | 143 | 105 | -1.1 |
| 1985–1990 | 435 | 54 | 381 | 45.1 | 5.6 | 6.76 | 41 | 51 | 105 | 3.6 |
| 1995–2000 | 595 | 60 | 535 | 40.7 | 4.1 | 5.81 | 27 | 33 | 105 | 4.2 |
| 2000–2005 | 607 | 63 | 544 | 35.7 | 3.7 | 5.02 | 24 | 28 | 105 | 2.1 |
| 2005–2010 | 649 | 67 | 581 | 34.0 | 3.5 | 4.60 | 21 | 25 | 105 | 2.5 |
| 2010-2015 | 706 | 75 | 631 | 32.9 | 3.5 | 4.25 | 19 | 23 | 105 | 2.2 |
| 2015-2020 | 708 | 83 | 625 | 29.4 | 3.5 | 3.67 | 17 | 20 | 105 | 2.4 |
| * 연평균 기준이며, 예외적으로 출생아 수, 사망자 수, 자연 증감의 경우 연평균 기준이 아닌, 해당 기간 전체 수를 모두 합한 것임. | ||||||||||
2018년, 등재된 224개 국가 및 영토 중, 《CIA 월드 팩트북(The World Factbook)》에 따르면, 서안 지구는 합계출산율(TFR) 3.2명으로 48위, 가자 지구는 TFR 3.97명으로 31위를 기록했다.[32] 2018년, 서안 지구의 추정 인구 성장률은 1.81% (세계 국가 비교: 56위)였고, 가자 지구의 인구 성장률은 2.25% (35위)였다.[48][47][33]
{| class="wikitable sortable"
|-
!
! style="width:80pt;" |연도 중반 인구(천 명)
! style="width:80pt;" |출생아 수(천 명)
! style="width:80pt;" |사망자 수(천 명)
! style="width:80pt;" |자연 증가(천 명)
! style="width:80pt;" |조출생률(1,000명당)
! style="width:80pt;" |조사망률(1,000명당)
! style="width:80pt;" |자연 증가율(1,000명당)
! style="width:80pt;" |합계출산율 (TFR)
! style="width:80pt;" |영아 사망률 (출생아 1,000명당)
! style="width:80pt;" |기대 수명 (년)
|-
|1950
| 945
| 46
| 20
| 26
|48.3
|21.0
|27.3
|7.84
|142.3
|45.79
|-
|1951
| 953
| 47
| 20
| 27
|48.5
|20.9
|27.7
|7.84
|141.7
|45.88
|-
|1952
| 963
| 47
| 20
| 27
|48.7
|20.6
|28.1
|7.84
|140.5
|46.09
|-
|1953
| 973
| 48
| 20
| 28
|48.9
|20.4
|28.5
|7.83
|139.1
|46.33
|-
|1954
| 985
| 49
| 20
| 29
|49.2
|20.1
|29.1
|7.83
|137.5
|46.61
|-
|1955
| 997
| 50
| 20
| 30
|49.4
|19.8
|29.6
|7.82
|135.8
|46.92
|-
|1956
| 1 010
| 51
| 20
| 31
|49.7
|19.5
|30.2
|7.82
|133.8
|47.27
|-
|1957
| 1 025
| 52
| 20
| 32
|49.9
|19.1
|30.8
|7.81
|131.7
|47.66
|-
|1958
| 1 040
| 53
| 20
| 33
|50.1
|18.7
|31.4
|7.81
|129.4
|48.08
|-
|1959
| 1 057
| 54
| 19
| 34
|50.3
|18.3
|32.0
|7.81
|126.9
|48.53
|-
|1960
| 1 074
| 55
| 19
| 35
|50.4
|17.8
|32.6
|7.79
|124.3
|49.01
|-
|1961
| 1 092
| 56
| 19
| 36
|50.4
|17.3
|33.1
|7.79
|121.4
|49.55
|-
|1962
| 1 110
| 57
| 19
| 38
|50.5
|16.8
|33.7
|7.79
|118.4
|50.12
|-
|1963
| 1 128
| 57
| 19
| 39
|50.4
|16.3
|34.2
|7.78
|115.1
|50.75
|-
|1964
| 1 142
| 58
| 18
| 40
|50.4
|15.7
|34.6
|7.78
|111.7
|51.38
|-
|1965
| 1 149
| 59
| 18
| 41
|50.3
|15.2
|35.1
|7.78
|108.2
|52.03
|-
|1966
| 1 148
| 59
| 17
| 42
|50.2
|14.6
|35.5
|7.75
|104.7
|52.69
|-
|1967
| 1 137
| 58
| 18
| 41
|50.1
|15.2
|34.9
|7.74
|101.1
|50.97
|-
|1968
| 1 123
| 57
| 16
| 42
|49.9
|13.5
|36.3
|7.71
|97.7
|54.03
|-
|1969
| 1 115
| 57
| 15
| 42
|49.7
|13.0
|36.6
|7.68
|94.1
|54.70
|-
|1970
| 1 118
| 56
| 14
| 42
|49.4
|12.5
|36.9
|7.65
|90.6
|55.35
|-
|1971
| 1 136
| 56
| 14
| 43
|49.2
|12.0
|37.2
|7.61
|87.3
|55.99
|-
|1972
| 1 167
| 57
| 14
| 44
|49.0
|11.5
|37.5
|7.59
|84.0
|56.65
|-
|1973
| 1 195
| 59
| 31
| 28
|49.2
|26.0
|23.2
|7.55
|80.8
|34.74
|-
|1974
| 1 225
| 61
| 13
| 48
|49.3
|10.6
|38.7
|7.52
|77.8
|57.98
|-
|1975
| 1 264
| 62
| 13
| 49
|49.1
|10.2
|38.9
|7.48
|74.8
|58.64
|-
|1976
| 1 301
| 64
| 13
| 51
|48.8
|9.7
|39.1
|7.44
|71.6
|59.32
|-
|1977
| 1 337
| 65
| 13
| 53
|48.4
|9.3
|39.1
|7.38
|68.5
|60.00
|-
|1978
| 1 374
| 66
| 12
| 54
|48.0
|8.9
|39.1
|7.33
|65.6
|60.66
|-
|1979
| 1 413
| 68
| 12
| 56
|47.6
|8.4
|39.2
|7.28
|62.4
|61.39
|-
|1980
| 1 454
| 69
| 12
| 57
|47.3
|8.0
|39.3
|7.23
|59.2
|62.11
|-
|1981
| 1 498
| 71
| 11
| 59
|47.0
|7.6
|39.4
|7.17
|56.2
|62.79
|-
|1982
| 1 546
| 73
| 11
| 61
|46.8
|7.2
|39.6
|7.12
|53.4
|63.45
|-
|1983
| 1 604
| 75
| 11
| 64
|46.6
|6.9
|39.7
|7.07
|50.5
|64.16
|-
|1984
| 1 674
| 78
| 11
| 67
|46.4
|6.5
|39.9
|7.01
|47.9
|64.80
|-
|1985
| 1 731
| 81
| 11
| 70
|46.1
|6.2
|39.9
|6.95
|45.6
|65.36
|-
|1986
| 1 775
| 82
| 11
| 71
|46.0
|6.0
|40.0
|6.91
|43.6
|65.86
|-
|1987
| 1 863
| 84
| 11
| 74
|46.0
|5.7
|40.2
|6.88
|41.3
|66.42
|-
|1988
| 1 963
| 90
| 11
| 79
|45.9
|5.5
|40.4
|6.85
|39.2
|66.84
|-
|1989
| 2 041
| 94
| 11
| 83
|45.9
|5.3
|40.6
|6.81
|37.4
|67.28
|-
|1990
| 2 125
| 98
| 11
| 87
|46.0
|5.1
|40.9
|6.78
|35.8
|67.93
|-
|1991
| 2 214
| 102
| 11
| 91
|45.9
|4.9
|40.9
|6.72
|34.7
|68.31
|-
|1992
| 2 310
| 105
| 11
| 94
|45.6
|4.8
|40.8
|6.63
|33.3
|68.59
|-
|1993
| 2 411
| 108
| 11
| 97
|44.8
|4.7
|40.1
|6.50
|32.1
|68.85
|-
|1994
| 2 515
| 110
| 11
| 99
|43.8
|4.4
|39.4
|6.34
|30.7
|69.41
|-
|1995
| 2 623
| 112
| 11
| 101
|42.8
|4.3
|38.5
|6.18
|29.6
|69.66
|-
|1996
| 2 734
| 114
| 11
| 102
|41.6
|4.1
|37.5
|6.00
|28.6
|70.06
|-
|1997
| 2 847
| 115
| 11
| 104
|40.5
|4.0
|36.5
|5.82
|27.6
|70.40
|-
|1998
| 2 951
| 118
| 12
| 106
|39.8
|3.9
|35.9
|5.70
|26.8
|70.63
|-
|1999
| 3 044
| 120
| 12
| 108
|39.2
|3.8
|35.3
|5.58
|26.0
|70.86
|-
|2000
| 3 140
| 121
| 13
| 108
|38.4
|4.0
|34.5
|5.44
|25.3
|70.39
|-
|2001
| 3 230
| 122
| 13
| 109
|37.7
|4.1
|33.6
|5.32
|24.6
|69.89
|-
|2002
| 3 309
| 123
| 13
| 111
|37.1
|3.8
|33.2
|5.19
|24.1
|70.97
|-
|2003
| 3 384
| 123
| 13
| 110
|36.1
|3.8
|32.3
|5.02
|23.2
|71.05
|-
|2004
| 3 460
| 124
| 13
| 111
|35.7
|3.8
|31.9
|4.94
|22.4
|71.18
|-
|2005
| 3 541
| 125
| 13
| 112
|35.2
|3.6
|31.6
|4.84
|21.7
|72.07
|-
|2006
| 3 628
| 125
| 13
| 112
|34.5
|3.6
|30.8
|4.72
|21.0
|71.92
|-
|2007
| 3 718
| 125
| 13
| 112
|33.6
|3.6
|30.0
|4.61
|20.3
|72.15
|-
|2008
| 3 809
| 128
| 14
| 114
|33.5
|3.6
|29.9
|4.50
|19.9
|72.41
|-
|2009
| 3 899
| 131
| 14
| 117
|33.4
|3.6
|29.9
|4.41
|19.3
|72.61
|-
|2010
| 3 992
| 135
| 14
| 121
|33.7
|3.5
|30.2
|4.38
|18.6
|73.00
|-
|2011
| 4 088
| 137
| 14
| 123
|33.4
|3.5
|29.9
|4.27
|18.1
|73.24
|-
|2012
| 4 184
| 138
| 14
| 124
|32.9
|3.4
|29.5
|4.16
|17.6
|73.47
|-
|2013
| 4 282
| 140
| 14
| 125
|32.5
|3.3
|29.2
|4.08
|17.2
|74.0
3. 2. 4. 기대 수명
wikitext| 기간 | 기대수명 | 기간 | 기대수명 |
|---|---|---|---|
| 1950–1955 | 46.6 | 1985–1990 | 66.95 |
| 1955–1960 | 48.23 | 1990–1995 | 68.95 |
| 1960–1965 | 50.76 | 1995–2000 | 70.42 |
| 1965–1970 | 54.09 | 2000–2005 | 71.53 |
| 1970–1975 | 57.44 | 2005–2010 | 72.45 |
| 1975–1980 | 60.66 | 2010–2015 | 73.09 |
| 1980–1985 | 64.21 | 2015-2020 | 73.82 |
출처: 유엔 세계인구전망 2019[67]
0세의 총 인구의 평균 기대 수명.[44]
| 기간 | 기대 수명 (년) | 기간 | 기대 수명 (년) |
|---|---|---|---|
| 1950–1955 | 46.6 | 1985–1990 | 67.1 |
| 1955–1960 | 48.2 | 1990–1995 | 68.9 |
| 1960–1965 | 50.8 | 1995–2000 | 70.3 |
| 1965–1970 | 54.1 | 2000–2005 | 71.2 |
| 1970–1975 | 57.5 | 2005–2010 | 72.0 |
| 1975–1980 | 61.0 | 2010–2015 | 72.9 |
| 1980–1985 | 64.4 |
총 인구: 74.4세
남성: 72.7세
여성: 76.2세 (2018년 추정)
3. 3. 동예루살렘
4. 이스라엘 내 팔레스타인인 인구 통계
5. 팔레스타인 난민 문제
6. 인구 통계 관련 주요 쟁점
7. 결론
참조
[1]
문서
UN Security Council Resolution 446, Resolution 465, Resolution 484
[2]
웹사이트
Applicability of the Geneva Convention relative to the Protection of Civilian Persons in Time of War, of 12 August 1949, to the Occupied Palestinian Territory, including Jerusalem, and the other occupied Arab territories
http://domino.un.org[...]
United Nations
2006-09-27
[3]
웹사이트
EU-Settlements Watch
http://www.consilium[...]
2013-05-23
[4]
웹사이트
Legal Consequences of the Construction of a Wall in the Occupied Palestinian Territory
http://domino.un.org[...]
International Court of Justice
2006-09-27
[5]
웹사이트
Conference of High Contracting Parties to the Fourth Geneva Convention: statement by the International Committee of the Red Cross
http://www.icrc.org/[...]
International Committee of the Red Cross
2006-09-27
[6]
웹사이트
Statistical Abstract of Israel 2012
http://www1.cbs.gov.[...]
2013-01-15
[7]
웹사이트
Population of Israel on the Eve of 2018 – 8.8 Million
http://www.cbs.gov.i[...]
Israel Central Bureau of Statistics
2018-01-02
[8]
웹사이트
Estimated Population in the Palestine Mid-Year by Governorate,1997-2026
https://pcbs.gov.ps/[...]
Palestinian Central Bureau of Statistics, State of Palestine
2024-01-01
[9]
웹사이트
The Separation Barrier – Statistics
http://www.btselem.o[...]
B'Tselem
2013-04-05
[10]
웹사이트
WEST BANK Jewish Population Stats (not including eastern Jerusalem) UPDATED TO: JANUARY 1, 2024
https://www.dropbox.[...]
2024-01-01
[11]
뉴스
Jewish settler population in the West Bank surpasses half a million
https://www.latimes.[...]
2023-02-02
[12]
웹사이트
Addressing the Needs of Palestinian Households in Area C of the West Bank - Findings of the First Comprehensive Household Survey (January 2019) - occupied Palestinian territory
https://reliefweb.in[...]
Oxfam
2019-06-26
[13]
웹사이트
Occupied Palestinian Territory Area C of the West Bank
https://www.ochaopt.[...]
UN Office for the Coordination of Humanitarian Affairs
2014-08
[14]
문서
Sum of Israeli and Palestinian estimates
[15]
웹사이트
Area C Humanitarian Response Plan Fact Sheet September 2010.
http://www.ochaopt.o[...]
2010-10-05
[16]
뉴스
Regions and territories: The Golan Heights
http://news.bbc.co.u[...]
BBC News
[17]
문서
Security Council Resolutions
https://www.un.org/D[...]
United Nations
1981
[18]
문서
UN Security Council Resolution 497
http://www.cfr.org/c[...]
Council on Foreign Relations
[19]
뉴스
III/5 Population of Jerusalem by Population Group, Religious Identification, Quarter and Sub-Quarter, 2021 in Jerusalem Statistical Yearbook
https://jerusalemins[...]
Jerusalem Institute for Policy Research
2021
[20]
웹사이트
Barrier Report July 2009. Calculation based on East Jerusalem area of 346km2 being 97% west of the barrier, and 9.5% of the West bank including East Jerusalem being in the Seam Zone
http://www.ochaopt.o[...]
2010-10-05
[21]
문서
Figure calculated from other sourced figures in table
[22]
문서
Derived from total CBS Population of Israel 31-Dec-2023 minus estimates for East Jerusalem Israelis and non-Israeli Palestinians, minus Golan Heights, minus 1/1/24 estimate of settlers in Area C
[23]
웹사이트
Trump acceptance of Israeli control of Golan sparks protests
https://apnews.com/b[...]
Associated Press
2019-03-29
[24]
뉴스
'This is our moment': Israel okays major plan to boost Golan, double its population
https://www.timesofi[...]
2021-12-26
[25]
웹사이트
"Area of the State of Israel", All Terms
https://www.cbs.gov.[...]
Central Bureau of Statistics, State of Israel
2023-12-31
[26]
웹사이트
"Population of Israel", All Terms
https://www.cbs.gov.[...]
www.cbs.gov.il
2023-12-31
[27]
서적
Jerusalem: Facts and Trends 2018: The State of the City and Changing Trends
http://en.jerusalemi[...]
Jerusalem Institute for Policy Research
[28]
논문
"Has Israel Annexed East Jerusalem?"
https://www.research[...]
Middle East Policy
2014-11-25
[29]
웹사이트
Israel
https://www.cia.gov/[...]
Central Intelligence Agency
2024-01-31
[30]
간행물
Palestine in Figures 2009
http://www.pcbs.gov.[...]
Palestinian Central Bureau of Statistics
2010-05
[31]
웹사이트
State of Palestine – General Information
http://data.un.org/e[...]
United Nations
2018-03-08
[32]
웹사이트
COUNTRY COMPARISON :: TOTAL FERTILITY RATE
https://www.cia.gov/[...]
CIA
2019-05-13
[33]
웹사이트
COUNTRY COMPARISON :: POPULATION GROWTH RATE
https://www.cia.gov/[...]
CIA
2018-03-08
[34]
웹사이트
US Census Bureau International Programs
https://www.census.g[...]
US Census Bureau
2013-10-14
[35]
간행물
Palestinians in figures 2009
http://www.pcbs.gov.[...]
Palestinian Central Bureau of Statistics
2010-05
[36]
간행물
Palestinians at the End of Year 2006
http://www.pcbs.gov.[...]
Palestinian Central Bureau of Statistics
[37]
간행물
Palestinian Central Bureau of Statistics
2018
[38]
웹사이트
PCBS | Indicators
https://www.pcbs.gov[...]
[39]
UN
cite UN WPP
2022
[40]
웹사이트
PCBS | Number of Registered Live Births in Palestine* by Region and Governorate, 2007 - 2020
https://www.pcbs.gov[...]
[41]
웹사이트
PCBS | Number of Registered Deaths in Palestine* by Region and Governorate, 2007 - 2020
https://www.pcbs.gov[...]
[42]
웹사이트
Demographic Yearbook
http://unstats.un.or[...]
United Nations
2015-12-04
[43]
웹사이트
Palestinian Children – Issues and Statistics Annual Report, 2012
https://www.pcbs.gov[...]
2023-10-20
[44]
웹사이트
World Population Prospects – Population Division – United Nations
https://esa.un.org/u[...]
2018-08-26
[45]
웹사이트
UNRWA: Palestine refugees
https://www.un.org/u[...]
United Nations
2010-06-01
[46]
뉴스
Middle East Christians: Gaza pastor
http://news.bbc.co.u[...]
BBC News
2005-12-21
[47]
웹사이트
Middle East :: Gaza Strip — the World Factbook – Central Intelligence Agency
https://www.cia.gov/[...]
2022-06-06
[48]
웹사이트
CIA – The World Factbook: West Bank
https://www.cia.gov/[...]
Cia.gov
2019-04-07
[49]
서적
The World Factbook
Cia.gov
2018-03-08
[50]
웹사이트
West Bank settler population surged during Trump era, report says
https://www.timesofi[...]
2021-01-28
[51]
웹사이트
Settlement population growth slows for 10th straight year
http://www.israelnat[...]
2019-12-04
[52]
서적
Non-Muslims in Muslim Majority Societies: With Focus on the Middle East and Pakistan
ISD LLC
[53]
기타
Israeli CBS 2011 data
http://cbs.gov.il/sh[...]
[54]
기타
US Census Bureau International Programs
https://www.census.g[...]
[55]
간행물
Palestinians in figures 2009
http://www.pcbs.gov.[...]
[56]
간행물
Palestinians at the End of Year 2006
http://www.pcbs.gov.[...]
[57]
웹인용
Middle East :: GAZA STRIP
https://www.cia.gov/[...]
CIA
2018-03-08
[58]
문서
South Korea 인구 밀도 정보
[59]
웹인용
Middle East :: WEST BANK
https://www.cia.gov/[...]
CIA
2019-05-13
[60]
문서
Hong Kong 인구 밀도 정보
[61]
문서
Guernsey 및 Taiwan 인구 밀도 정보
[62]
웹사이트
Palestinian Central Bureau of Statistics
http://www.pcbs.gov.[...]
[63]
웹사이트
http://unstats.un.or[...]
[64]
웹인용
보관된 사본
http://www.pcbs.gov.[...]
2021-08-21
[65]
웹인용
유엔 세계인구전망 2019
https://population.u[...]
[66]
웹인용
Total population, both sexes combined (thousands)
https://data.un.org/[...]
2021-08-21
[67]
웹인용
Life expectancy at birth for both sexes combined (years)
https://data.un.org/[...]
2021-08-22
[68]
웹인용
유엔 세계인구전망 2019
https://population.u[...]
[69]
웹인용
Demographic Yearbook
http://unstats.un.or[...]
United Nations
2015-12-04
본 사이트는 AI가 위키백과와 뉴스 기사,정부 간행물,학술 논문등을 바탕으로 정보를 가공하여 제공하는 백과사전형 서비스입니다.
모든 문서는 AI에 의해 자동 생성되며, CC BY-SA 4.0 라이선스에 따라 이용할 수 있습니다.
하지만, 위키백과나 뉴스 기사 자체에 오류, 부정확한 정보, 또는 가짜 뉴스가 포함될 수 있으며, AI는 이러한 내용을 완벽하게 걸러내지 못할 수 있습니다.
따라서 제공되는 정보에 일부 오류나 편향이 있을 수 있으므로, 중요한 정보는 반드시 다른 출처를 통해 교차 검증하시기 바랍니다.
문의하기 : help@durumis.com